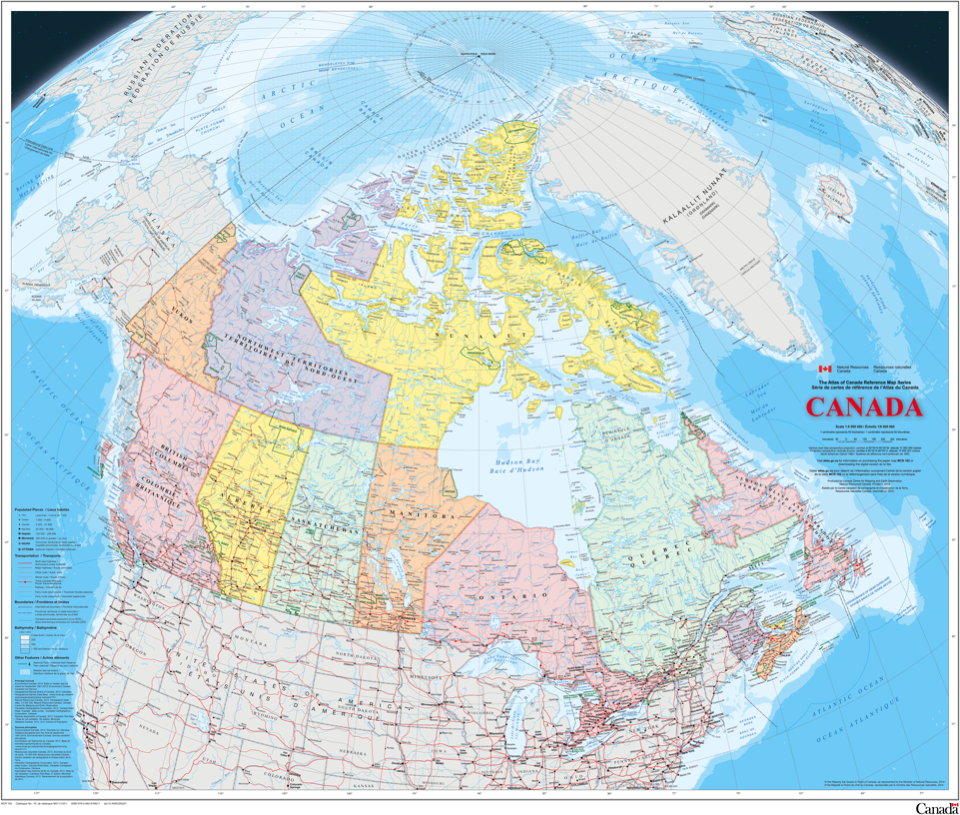
The federal government’s new map of Canada, part of the Atlas of Canada reference series, came out this week. Among the changes between it and its predecessor (which came out in 2006), one in particular is drawing attention. Ivan Semeniuk in the Globe and Mail:
Whereas the older version of the map showed only that part of the sea ice that permanently covered Arctic waters year round at that time, the new edition uses a 30-year median of September sea-ice extent from 1981 through 2010. September sea ice hit a record low in 2012 and is projected to decline further. The change means there is far more ice shown on the 2015 version of the map than on its predecessor.
The changes can be seen below: the 2006 map is on the left, the 2015 map on the right.

Now as Semeniuk’s piece points out, neither way is wrong. But all maps have a point of view, and it’s naive to think that this change was made in a value-neutral environment: this was the result of a conscious decision. The reason for that decision—that’s what’s interesting.


