New Gravity Map of Mars Reveals Subsurface Variations

Gravity map of Mars. The red circles show prominent volcanoes on Mars and the black circles show impact crates with a diameter larger than a few 100 km. A gravity high signal is located in the volcanic Tharsis Region (the red area in the centre right of the image), which is surrounded by a ring of negative gravity anomaly (shown in blue).
Gravity map of Mars, from Root et al.

A study presented earlier this month at the Europlanet Science Congress maps the variations in Mars’s gravitational field.

Dr Root and colleagues from TU Delft and Utrecht University used tiny deviations in the orbits of satellites to investigate the gravity field of Mars and find clues about the planet’s internal mass distribution. This data was fed into models that use new observations from NASA’s Insight mission on the thickness and flexibility of the martian crust, as well as the dynamics of the planet’s mantle and deep interior, to create a global density map of Mars.

The density map shows that the northern polar features are approximately 300-400 kg/m3 denser than their surroundings. However, the study also revealed new insights into the structures underlying the huge volcanic region of Tharsis Rise, which includes the colossal volcano, Olympus Mons.

Abstract, press release, Universe Today.

Previously: New Gravity Map of Mars.

New Gravity Map of Mars

NASA/Goddard/UMBC/MIT/E. Mazarico

A new gravity map of Mars that shows the thickness of the Martian crust based on gravity measurements from Martian orbiters, reveals a crust that is less dense and shows less variation than earlier maps. “The researchers mapped the density of the Martian crust, estimating the average density is 2,582 kilograms per meter cubed (about 161 pounds per cubic foot). That’s comparable to the average density of the lunar crust. Typically, Mars’ crust has been considered at least as dense as Earth’s oceanic crust, which is about 2,900 kilograms per meter cubed (about 181 pounds per cubic foot).”

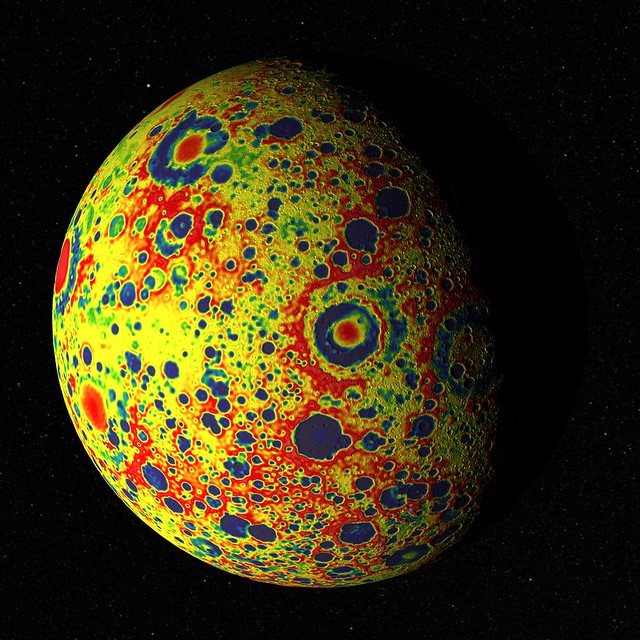
Lunar Gravity Map

Free-Air Gravity Map of the Moon
NASA has released a free-air gravity map of the Moon: “If the Moon were a perfectly smooth sphere of uniform density, the gravity map would be a single, featureless color, indicating that the force of gravity at a given elevation was the same everywhere. But like other rocky bodies in the solar system, including Earth, the Moon has both a bumpy surface and a lumpy interior. … The free-air gravity map shows deviations from the mean, the gravity that a cueball Moon would have.” Gravity data comes from the GRAIL mission, with the digital elevation model provided by the Lunar Reconnaissance Orbiter laser altimeter. Image credit: NASA’s Goddard Goddard Space Flight Center Scientific Visualization Studio.