Last month the Chinese Academy of Sciences released a set of geologic maps of the moon at 1:2,500,000 scale—twice the resolution of the USGS’s 1:5,000,000 scale maps. Available, it seems, as a geologic atlas as well as quadrangle maps—though it’s not immediately apparent from where. News: Nature, Popular Science, Universe Today.
Category: Geology
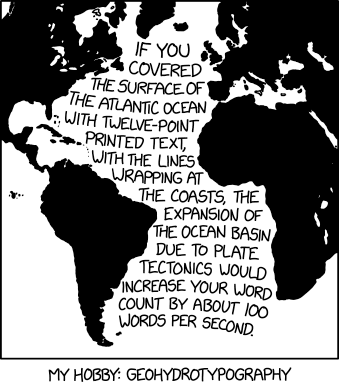
Visualizing Continental Drift, Typographically
Well, that’s one way to visualize the rate of continental drift.
Large-Scale Geologic Maps of Mars
The USGS’s Astrogeology Science Center highlights three geologic maps of Mars released in late 2021. The maps are large-scale, focusing on specific Martian features (e.g. Olympus Mons, above).
Though maps have historically covered large areas, with crewed lunar missions on the horizon and other missions across the solar system in the planning stages, large-scale, small-area maps are starting to steal the limelight. These large-scale, small-area maps provide highly detailed views of the surface and allow scientists to investigate complex geologic relationships both on and beneath the surface. These types of maps are useful for both planning for and then conducting landed missions.
The maps are of Olympus Mons Caldera, Athabasca Valles and Aeolis Dorsa. Interactive versions, with toggleable layers over spacecraft imagery, are also available: Olympus Mons Caldera, Athabasca Valles, Aeolis Dorsa.
Mapping the Watery Past of Mars
A new map of Mars reveals the abundance of aqueous minerals—clays and salts that form in the presence of water—that were created during the planet’s distant watery past. “The big surprise is the prevalence of these minerals. Ten years ago, planetary scientists knew of around 1000 outcrops on Mars. This made them interesting as geological oddities. However, the new map has reversed the situation, revealing hundreds of thousands of such areas in the oldest parts of the planet.”
‘The People Who Draw Rocks’
Melting glaciers are keeping a special team of cartographers at Swisstopo, Switzerland’s national mapping agency, busy: they’re the ones charged with making changes to the Swiss alps on Swisstopo’s maps. The New York Times reports:
“The glaciers are melting, and I have more work to do,” as Adrian Dähler, part of that special group, put it.
Dähler is one of only three cartographers at the agency—the Federal Office of Topography, or Swisstopo—allowed to tinker with the Swiss Alps, the centerpiece of the country’s map. Known around the office as “felsiers,” a Swiss-German nickname that loosely translates as “the people who draw rocks,” Dähler, along with Jürg Gilgen and Markus Heger, are experts in shaded relief, a technique for illustrating a mountain (and any of its glaciers) so that it appears three-dimensional. Their skills and creativity also help them capture consequences of the thawing permafrost, like landslides, shifting crevasses and new lakes.
The article is a fascinating look at an extraordinarily exacting aspect of cartography. [WMS]
Alaskan Ice in Retreat
This NASA Earth Observatory video looks at the retreat of Alaska’s Columbia Glacier since 1986. Transcript here.
Cross-stitched Earth Science Maps
Kara Prior cross-stitches earth science maps; her work includes a series of state bedrock geology maps (see also Reddit) and a bathymetry map of the Great Lakes (above), among other things. She has an Etsy store.
VERITAS Mission to Map Venus Later This Decade
VERITAS is one of two missions to Venus announced by NASA last week. Expected to launch between 2028 and 2030, VERITAS will produce an improved map of the Venusian surface with its two instruments: synthetic aperture radar to generate a high-resolution 3D topographic map, and a spectral emissions mapper to map rock types. News coverage: CNN, Global News, Slate, The Verge. Background from NASA; analysis from the Planetary Society.
Historical Landslides in Canada
The third edition of a map showing landslides that have caused fatalities in Canada since 1771, created over six years by Geological Survey of Canada research scientist Andrée Blais-Stevens, was recently released. The Ottawa Citizen has the story; the map in question can be downloaded in PDF format here (48.7 MB).
One Billion Years of Continental Drift
So this animation went viral last week:
Pretty amazing full plate tectonic animation of the last billion years from @AndrewMerdith – Merdith et al. 2021 (Earth Science Reviews) @MullerDietmar @EarthByteGroup @UniAdelSciences https://t.co/Plne1y1Qm7 pic.twitter.com/IIFGRaZ3vD
— Alan Collins (@geoAlanC) January 29, 2021
It shows the movement of Earth’s tectonic plates over the past billion years, and it was posted by one of the co-authors of this study proposing a new, single model of plate tectonic activity that covers the past billion years of Earth’s existence. (Previous models, if I understand the abstract correctly, covered shorter periods—for several-hundred-million-year values of short—and didn’t line up with each other.)
Making 3D Art from Old Geological and Relief Maps
Apparently independently of one another, Sean Conway and Dmitriy Worontzov have been taking old geological and relief maps and applying using digital elevation models to apply 3D effects to them. The end result is a two-dimensional image, or a print, but it’s hard to shake the feeling that these maps now have real depth and texture. Conway, an orthoimagery specialist, works mainly on old U.S. relief maps; the results are available for sale as posters. Read more about him at My Modern Met. Worontzov, a Moscow-based art director, goes for geological maps, mainly from the Soviet era; see his work on Behance and Instagram, and read about him at Abduzeedo. [Alejandro Polanco, WMS]
A Slice Through America
Out last month from Princeton Architectural Press: A Slice Through America: A Geological Atlas by David Kassel. This is a history of stratigraphic illustrations, which Kassel has been collecting for decades. “Historic stratigraphic illustrations depict the earth beneath our feet in captivating hand-drawn diagrams. Each drawing tells a unique geologic story, exquisitely rendered in colors from pastel palettes to brilliant bolds that show evolving scientific graphic conventions over time. Created by federal and state geologists over the course of one hundred years, the maps reveal sedimentary rock layers that present an unexpected view of our treasured public lands, making this collection an important record of natural resources, as well as a beautiful display of map design.” Amazon (Canada, UK), Bookshop.
Ancient Earth Globe
The Ancient Earth Globe is a virtual globe that depicts the Earth of the distant past, with continents and oceans rearranged. Created by Ian Webster, it uses map data from the PALEOMAP project. [Strange Maps]
Two Geologic Maps of Venus
Two geological maps of Venus have been published in Earth and Space Science. Produced by Vicki L. Hansen and Iván López, they each cover a 60-million-square-kilometre section of Earth’s twin: the Niobe Planitia Map Area geologic map (above, top) ranges from the equator to 57° north, and from 60° to 180° east longitude; the geologic map of the Aphrodite Map Area (above, bottom) is the Niobe Map Area’s southern hemisphere equivalent, covering the area from 60° to 180° east longitude, but from the equator to 57° south.
Explore Zealandia
Zealandia (Te Riu-a-Māui) is the name given to a proposed, and largely submerged eighth continent, of which New Zealand (Aotearoa) is the largest above-water remnant. Explore Zealandia is geoscience company GNS Science’s web portal to their maps of this largely submerged continent, including bathymetry, tectonics, and other data; the data is also available for download. [WAML]