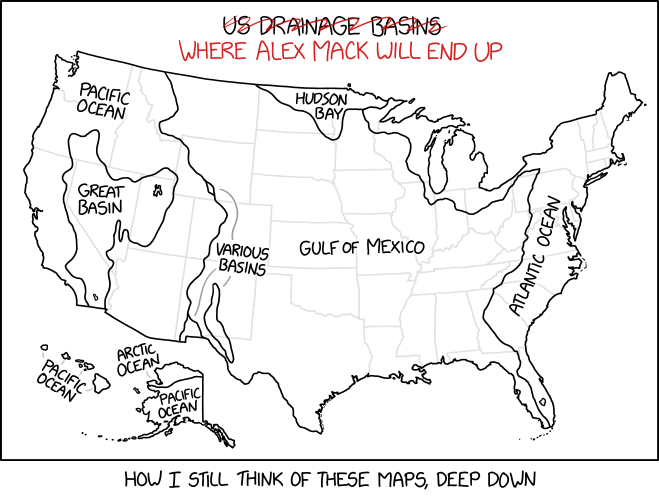
The Ocean Drainage Basin Maps of Robert Szucs

A map showing ocean drainage basins in the United States by Robert Scuzs of Grasshopper Geography.
Robert Szucs (Grasshopper Geography)

Smithsonian magazine takes a look at the ocean drainage basin maps of Robert Szucs, whose work we first saw in 2016. A lot has happened since then: he’s since produced hundreds of maps (and variations thereof) of the ocean drainage basins of various regions, countries and continents, and sells prints on his Grasshopper Geography website. The ocean drainage maps operate at a less precise level than the river basin maps, but there are plenty of examples of both. [MetaFilter]

Previously: River Basins in Rainbow Colours.

River Runner

Sam Learner’s River Runner is an amazing visualization that traces the path of a raindrop falling anywhere in the contiguous United States to where it reaches the ocean or leaves U.S. territory. “It’ll find the closest river/stream flowline coordinate to a click/search and then animate along that flowline’s downstream path.” It’s a tad resource-intensive, and if you end up in the Mississippi basin it will take a while (and make clear just how big that river system is), but it’s absolutely transfixing.

Daniel Huffman’s Atlas of North American Rivers

An Atlas of North American Rivers
From Daniel Huffman, An Atlas of North American Rivers (2020), Plate 7: Upper St. Lawrence.

Add An Atlas of North American Rivers to the list of Daniel Huffman’s long-unfinished projects that suddenly got finished lately. It’s a 48-page PDF of diagrammatic maps of North American river systems, from Alaska to Guatemala. The PDF can be downloaded here; if there’s interest he’ll do a hardcopy version, and, of course, prints are available for sale.

Previously: Landforms of Michigan.

The Changing Padma River

Padma River erosion animation
NASA Earth Observatory

Landsat observations have charted the erosion of the banks of the ever-changing Padma River, a major distributary of the Ganges in Bangladesh. This is vividly shown in this animation produced by NASA Earth Observatory, which “shows 14 false-color images of the Padma river between 1988 and 2018 taken by the Landsat 5 and 8 satellites. All of the images include a combination of shortwave infrared, near infrared, and visible light to highlight differences between land and water.” More on the erosion of the Padma River here.

River Basins in Rainbow Colours

river-basin-rainbow

The latest map to go viral is Robert Szucs’s dramatic and colourful map of the U.S. river basins. It’s even more spectacular in high resolution. Made with QGIS, the map separates river basin by colour and assigns stream thickness by Strahler number. I do have a couple of quibbles. The map doesn’t distinguish between the Hudson Bay and Atlantic watersheds: the Great Lakes and Red River basins are coloured the same way. And speaking of the Great Lakes, I have no idea why they look like ferns here. The map is available for sale on Etsy, along with similar maps of other countries, continents and regions. Daily Mail coverage.

Water Flows in Germany

everything-flows

Everything Flows is an interactive online map that shows how much water  comes into, is consumed in and flows out of Germany.

“Water flows” does not only refer to the hydrological processes related to natural watercourses. The project also answers the following questions: How much water flows through Germany in terms of natural, artificial and virtual flows? What are the different ways in which water is used and for what? Who uses it and why? And how much water flows out of Germany—physically and virtually?

[IÖW]