OpenStreetMap and Its Women Contributors

When I started contributing edits to OpenStreetMap in earnest, I couldn’t help notice certain idiosyncrasies in its tagging: for example, there was a tag for brothels, which I didn’t need to use, but there wasn’t one for daycares, which in Quebec there are rather a lot of. That seemed odd. And it was indicative of a project whose contributors were overwhelmingly male. On CityLab, Sarah Holder examines OSM’s abysmally low female participation rate (only two to five percent of contributors are women), makes the case for better representation, and looks at where women are making a difference to the map. Because a map built overwhelmingly by men can have some massive blind spots.

When it comes to increasing access to health services, safety, and education—things women in many developing countries disproportionately lack—equitable cartographic representation matters. It’s the people who make the map who shape what shows up. On OSM, buildings aren’t just identified as buildings; they’re “tagged” with specifics according to mappers’ and editors’ preferences. “If two to five percent of our mappers are women, that means only a subset of that get[s] to decide what tags are important, and what tags get our attention,” said Levine.

Sports arenas? Lots of those. Strip clubs? Cities contain multitudes. Bars? More than one could possibly comprehend.

Meanwhile, childcare centers, health clinics, abortion clinics, and specialty clinics that deal with women’s health are vastly underrepresented. In 2011, the OSM community rejected an appeal to add the “childcare” tag at all. It was finally approved in 2013, and in the time since, it’s been used more than 12,000 times.

Interestingly, when you look at crisis mappers, the female participation rate jumps: to 27 percent, based on a survey of the Humanitarian OpenStreetMap Team community.

OpenStreetMap ‘In Serious Trouble’

Much chatter on Twitter about a blog post criticizing OpenStreetMap that made it to the front page of Hacker News; problem is, said chatter hasn’t been linking to said blog post. Here it is: “Why OpenStreetMap is in Serious Trouble,” in which Serge Wroclawski argues that OSM has lost its way on a technical and management level:

Before I criticize the project, I want to state emphatically that I still believe wholeheartedly in the core principles of OpenStreetMap. We need a Free as in Freedom geographic dataset just as much today as we did in the past. When I wrote my article about OSM in 2012, self-driving cars and other services were still a dream. Today the importance of having a highly accurate, libre geographic dataset is more important than ever, and I support those working to make it happen.

That said, while I still believe in the goals of OpenStreetMap, I feel the OpenStreetMap project is currently unable to fulfill that mission due to poor technical decisions, poor political decisions, and a general malaise in the project. I’m going to outline in this article what I think OpenStreetMap has gotten wrong. It’s entirely possible that OSM will reform and address the impediments to its success—and I hope it does. We need a Free as in Freedom geographic dataset.

I do love me a good rant; and as an OSM contributor myself, I do recognize some of the problems Serge highlights, particularly the difficulties in importing data, moderating edits, and vandalism.

Since getting linked there is what drew attention to it, Hacker News comments (I know, I know) are here.

Previously: OpenStreetMap at the Crossroads.

Esri Makes Satellite Imagery Available to OpenStreetMap Editors

Esri is making its satellite imagery collection available to OpenStreetMap editors.

Today Esri is proud to announce that we are making our own global collection of satellite imagery available to the OSM community directly through our existing World Imagery Service. This regularly updated resource provides one meter or better satellite and aerial photography in many parts of the world, 15m TerraColor imagery at small and mid-scales (~1:591M down to ~1:72k), 2.5m SPOT Imagery (~1:288k to ~1:72k), 1 meter or better NAIP in the US and many other curated sources, so we know it will make a welcome addition to OSM’s growing catalog of reference layers.

OSM editors have been able to trace maps from satellite imagery for years; other sources of such imagery have included Bing and Yahoo (back when Yahoo Maps was a thing). Different sources have different strengths, so this can only help the project. (Esri’s imagery makes no difference where I am, but that’s not a surprise.)

OSM Then and Now

OSM Then and Now (screenshot)

Martijn van Exel’s OSM Then and Now compares OpenStreetMap as it was in October 2007 with how it is today, with a slider to change how much you see of one or the other. Amazing how little was mapped back then, especially outside: my own town didn’t appear at all, and even Ottawa was rudimentary.

Missing Maps

Quartz takes a look at the Missing Maps project, which I suppose can best be described as a way to jumpstart mapping the unmapped developing regions of the world with OpenStreetMap. What’s interesting about Missing Maps is how it systematically deals out tasks to people best able to do them: remote volunteers trace imagery, community volunteers do the tagging and labelling. There’s even an app, MapSwipe, that gives its users “the ability to swipe through satellite images and indicate if they contain features like houses, roads or paths. These are then forwarded onto Missing Maps for precise marking of these features.” [WMS]

Hurricane Matthew Map Roundup

nhc-matthew

Start with the National Hurricane Center, which has lots of different maps of Hurricane Matthew’s predicted path, weather warnings, rainfall potential and so forth. See also maps from Weather Underground.

Google’s Crisis Map includes evacuation resources—Red Cross shelters, evacuation routes, traffic data—in addition to storm track and precipitation information.

Matthew has already struck southwest Haiti; the Humanitarian OSM Team has put out a call for crisis mappers on the following projects: buildings in Nippes; road network in Grand’Anse and Sud.

earthwindmap-matthew

Wind maps from Windytv and EarthWindMap visualize the wind patterns of Matthew and, further out in the Atlantic, Nicole.

Hurricane imagery from NOAA’s GOES East satellite. NASA Earth Observatory has imagery of Matthew’s path toward Florida.

[Dave Smith/Maps Mania/NASA Earth/NOAA Satellites]

OpenStreetMap at the Crossroads

“The OpenStreetMap Community is at a crossroads, with some important choices on where it might choose to head next,” wrote Michal Migurski last month. Identifying three types of map contributors—robot mappers using third party data, crisis mappers responding to a disaster like the Haiti earthquake, and so-called “local craft mappers” (i.e., the original OSM userbase that edits the map at the community level, using GPS tracks and local knowledge), Michal ruffled many feathers by saying that “[t]he first two represent an exciting future for OSM, while the third could doom it to irrelevance.” That’s largely because, in his view, the craft mappers’ passivity and complacency, and their entrenched position in the OSM hierarchy, are impeding the efforts of the other two groups.

Continue reading “OpenStreetMap at the Crossroads”

A Multilingual Map of India

Arun Ganesh talks about making a multilingual map of India: “Hardly anyone in India even knows that OSM can handle regional languages, simply because its not visible anywhere on the map. After some recent interest from the community in making regional language maps for openstreetmap.in, I decided to give this a shot to make a multilingual place map for India using OSM and Mapbox Studio that I have been playing with recently.”

Importing CanVec Data into OpenStreetMap

Last February I imported CanVec data into OpenStreetMap for the first time.

CanVec is a dataset produced by the federal Department of Natural Resources. It’s been made available to use in OpenStreetMap: users have to download the data for a given area and import it into the OSM database.

It’s a great resource, but I’ve been giving CanVec the side eye for years, largely because OSM users had been bungling the imports and not cleaning up the mess they made. To some extent it also encouraged a certain amount of laziness from Canadian OSM users: why go to the trouble of tracing imagery or going out with a GPS if you could just download the data from the Natural Resources FTP server?

That said, most of my complaints were from a few years ago; it’s been a while since I’ve seen a CanVec-induced mess in the database (for example, doubled or even tripled roads imported on top of one another). And between existing imports and the improved Bing aerial and satellite imagery coverage, there weren’t many places I was aware of that I could, you know, try a CanVec import for myself.

Except one.

Continue reading “Importing CanVec Data into OpenStreetMap”

OpenStreetMap’s New Map Editor

OpenStreetMap has launched a new map editing interface that runs, for the first time, in HTML5. (Potlatch, the previous web-based map editor, uses Flash, and JOSM runs in Java, which I always thought was ironic for an open project.) The editor, called iD, is live now, and is designed to make editing the map more accessible to beginning mapmakers. I’ve given it a quick try this morning. My summary judgment is that if you have any experience using another editor, you should stick with it. iD is far slower than Potlatch at the moment, and does things sufficiently differently that you might have a hard time finding things. I made a mess trying to edit the existing map. But will it lower the barrier to making new contributions, particularly for casual or non-technical contributors? I hope so.

All Online Maps Suck

This is something I’ve been meaning to write for a while. I should have written it last December, during the hullaballoo over Apple’s maps, but I’ve never been one to strike when the iron is hot.

You’ll recall that there were a lot of complaints about Apple’s maps app when it launched with iOS 6, replacing the previous app that was powered by Google Maps. The map data didn’t match the user experience: it was a first-rate app that used second-rate data. Apple oversold the experience and failed to meet the high expectations of its customers. It was a problem that no other online map provider had ever had to deal with before, not least because no one had launched a new map service with the same amount of hubris, nor the same amount of scrutiny from day one.

But many of the complaints about Apple’s maps verged into hyperbole. The notion that Apple’s maps were uniquely bad compared to other online maps was frankly unfair. Because when you get right down to it, all online maps suck. They all fail in some way, somewhere, and some more than others—and if the maps you use seem fine to you, it’s because they suck somewhere else.

Continue reading “All Online Maps Suck”

OpenStreetMap in Ottawa

I nearly forgot to mention that last Sunday I gave a presentation on the state of OpenStreetMap in Ottawa to the SummerCamp 2011 Mapping Party. It was a small group — five of us, the majority of whom knew more about the subject than I did — and, due to technical snafus with the meeting location, was held in a Bridgehead coffee shop on Bank Street. All the same, my spiel was well received. I made three points in the presentation: that OpenStreetMap was a lot less complete than some make it out to be; that the OSM map of Ottawa needs a lot of work; and here’s what to do about it.

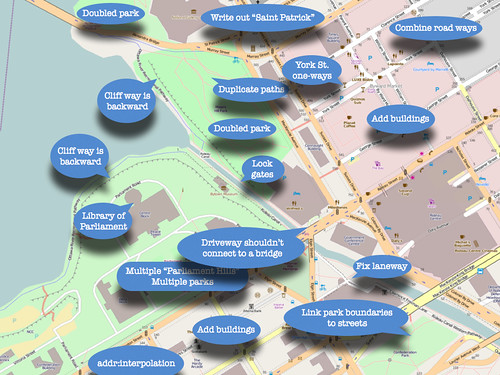
I suppose that I could make the slideshow available if you’re really interested, but my presentations tend to be talks illustrated by slides, rather than read-the-slides, so without me talking it through it’d be kind of confusing. But here’s the penultimate slide, which shows a screencap of OSM’s map of downtown Ottawa, with things that need fixing helpfully labelled.

Ottawa Mapping Party Presentation

You’ll be happy to know that many of these things have since been fixed.