First Geologic Map of Titan

Geologic map of Titan
NASA/JPL-Caltech/ASU

The first global geologic map of Titan, based on radar and infrared data from the Cassini probe, has been released.

The map legend colors represent the broad types of geologic units found on Titan: plains (broad, relatively flat regions), labyrinth (tectonically disrupted regions often containing fluvial channels), hummocky (hilly, with some mountains), dunes (mostly linear dunes, produced by winds in Titan’s atmosphere), craters (formed by impacts) and lakes (regions now or previously filled with liquid methane or ethane). Titan is the only planetary body in our solar system other than Earth known to have stable liquid on its surface—methane and ethane.

The map is the result of research published today in Nature Astronomy.

Previously: Titan in Infrared; Mapping Titan with VIMS; A Topographic Map of Titan.

Titan in Infrared

NASA/JPL-Caltech/University of Nantes/University of Arizona

Because of its thick and opaque atmosphere, Titan had to be mapped in radar and infrared during a series of close flybys by the Cassini spacecraft. One artifact of this process: the resolution, lighting and atmospheric conditions were not consistent, so mosaic images and maps of Titan’s surface showed visible seams. That’s been corrected in these infrared images of Titan’s surface, released last week. The false-colour images remap infrared wavelengths to the visible spectrum, using a band-ratio technique that minimizes seams. “With the seams now gone, this new collection of images is by far the best representation of how the globe of Titan might appear to the casual observer if it weren’t for the moon’s hazy atmosphere, and it likely will not be superseded for some time to come.”

Previously: Mapping Titan with VIMS.

Mapping Titan with VIMS

titan-pia20022

Because of its thick and opaque atmosphere, Saturn’s largest moon, Titan, has to be mapped piece by piece during close fly-bys by the Cassini spacecraft, using radar, infrared and visual data. The above image is one of two montages that “shows four synthetic views of Titan created using data acquired by the visual and infrared mapping spectrometer (VIMS) on board NASA’s Cassini spacecraft between 2004 and 2015. These views demonstrate some of the progress researchers have made in creating smooth-looking maps of Titan from the multitude of different VIMS observations made under a wide variety of lighting and viewing conditions.” More on VIMS here.

Previously: Titan in StereoTopography of Titan“Extraterrestrial Islands in a Methane Sea”Mapping the Solar System: Mercury and TitanHuygens Probe Images of Titan.

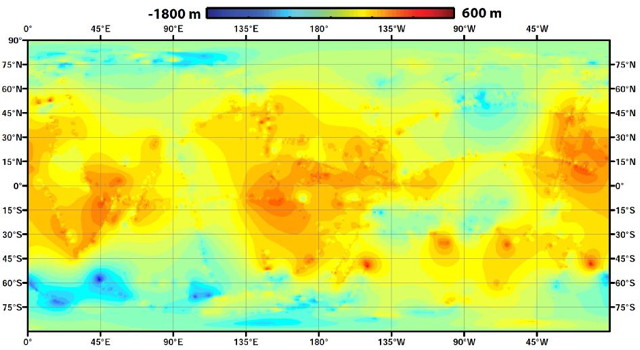
A Topographic Map of Titan

Global topographic map of Titan (NASA/JPL-Caltech/ASI/JHUAPL/Cornell/Weizmann)
NASA/JPL-Caltech/ASI/JHUAPL/Cornell/Weizmann

The Cassini team has released a global topographic map of Saturn’s moon Titan. What makes this map interesting is the fact that, due to its thick atmosphere, Titan can only be mapped by radar during Cassini’s close flybys. As a result, only half of its surface has been imaged, and only 11 percent has topography data. For this map, the remainder was, well, extrapolated:

Lorenz’s team used a mathematical process called splining—effectively using smooth, curved surfaces to “join” the areas between grids of existing data. “You can take a spot where there is no data, look how close it is to the nearest data, and use various approaches of averaging and estimating to calculate your best guess,” he said. “If you pick a point, and all the nearby points are high altitude, you’d need a special reason for thinking that point would be lower. We’re mathematically papering over the gaps in our coverage.”

Topo maps of parts of Titan have been released before, but not for the entire moon. See previous posts on The Map Room: Titan in Stereo; Topography of Titan.