Mapping the Pacific Coast in the Age of Exploration: An Exhibition

Opening today at the Santa Barbara Museum of Natural History: The Kingdom of California: Mapping the Pacific Coast in the Age of Exploration, an exhibition of 16th- to 19th-century maps and books from the museums own rare book collection, the Map and Atlas Museum of La Jolla and the Santa Barbara Mission Archive-Library. The Santa Maria Times notes the inclusion of maps showing California as an island as well as 19th-century coastal charts. Admission included with museum admission, runs until 2 January 2019. [WMS]

Mapping the Northern California Wildfires

Washington Post (screenshot)

The Washington Post maps the largest of the wildfires burning in northern California: the Carr Fire threatening the city of Redding and surrounding communities. The Redding Record Searchlight has drone footage of the destruction wreaked by the Carr Fire in Shasta County. NASA has natural and false-colour imagery (Earth Observatory, Visible Earth) of the Carr Fire, as well as the Ranch and River Fires to the south, the so-called Mendocino Complex. See the Mercury News’s fire map of the Mendocino Complex, whose two fires’ combined acreage is now larger than the Carr Fire. Meanwhile, German astronaut Alexander Gerst observed the California wildfires from the International Space Station. [San Francisco Chronicle]

How to Build a Fire Map

Last October Robin Kraft posted an online map of the northern California wildfires showing satellite imagery from before and after the fires (see previous entry); today he’s posted a blog entry explaining how he built it, in great technical detail. The timing is not accidental: “There is another fire raging in Los Angeles right now — if DigitalGlobe and Planet release their data, you can use this guide to make your own map.”

Google Using Street View Cars to Map Air Pollution

Google

Google is using its Street View cars, now equipped with air-quality sensors, to measure air pollution in California on a block-by-block level.

Earlier this year, we shared the first results of this effort with pollution levels throughout the city of Oakland.

We’re just beginning to understand what’s possible with this hyper-local information and today, we’re starting to share some of our findings for the three California regions we’ve mapped: the San Francisco Bay Area, Los Angeles, and California’s Central Valley (the Street View cars drove 100,000 miles, over the course of 4,000 hours to collect this data!) Scientists and air quality specialists can use this information to assist local organizations, governments, and regulators in identifying opportunities to achieve greater air quality improvements and solutions.

California Wildfires: Mapping Sonoma County

Sonoma County’s wildfire information page points to a number of useful maps: fire perimeter boundary maps, current evacuation areas, road closures, rapid evaluation safety assessment (RESA) maps. The City of Santa Rosa’s emergency information page also has maps specific to that city; Heavy also has a roundup. See also Cal Fire’s structural status information map. [The Mercury News]

Previously: Mapping the Northern California Wildfires.

Mapping the Northern California Wildfires

NASA Earth Observatory

Maps and satellite imagery of the wildfires in Northern California include the San Francisco Chronicle’s interactive map; Robin Kraft’s interactive map  showing satellite imagery from before and after the fire; this New York Times page mapping building damage in Santa Rosa; the Washington Post’s coverage of the devastation; and NASA Earth Observatory’s images of the smoke plumes here and here.

Two Upcoming Exhibitions

California as an Island and Worlds That Never Were, an exhibition of maps from the Roy V. Boswell Collection for the History of Cartography at California State University at Fullerton. Runs from 22 January to 29 March at CSU Fullerton’s Pollak Library. News release. [WMS]

Mapping Texas: From Frontier to the Lone Star State features maps spanning more than 400 years of Texas history, mostly from the Texas General Land Office, as well as two museums and private collectors. Runs from 27 January to 8 October at the Houston Museum of Natural Science. News release. [WMS]

The California Hiking Map

california-hiking-map The California Hiking Map is a poster-sized (40″×60″) map of California that purports to show all of the state’s hiking trails on a single map. “The trails shown generally include hiking trails, Class 1 bike paths, and fire roads closed to vehicles. This map also highlights select long distance trails and historical trails. Insets were made for some areas that have a high volume of trails in close proximity.” The result of two years work and a Kickstarter campaign, the map costs $20 plus tax and shipping. [Ryan Mik]

Monterey Bay Area Seafloor Maps Released

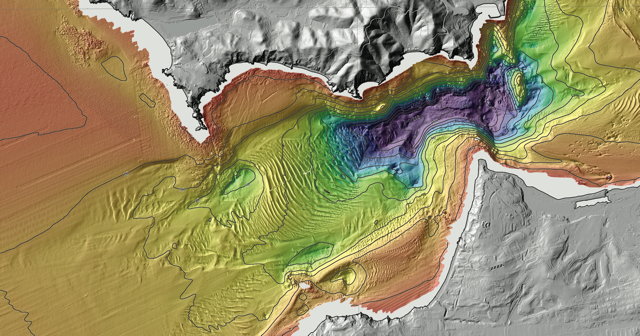
New seafloor maps of the Monterey Bay area have been released as part of the California Seafloor Mapping Program. The maps “reveal the diverse and complex range of seafloor habitats along 130 kilometers (80 miles) of the central California coast from the Monterey Peninsula north to Pigeon Point.” [Leventhal Map Center]

Previously: Mapping the California Sea Floor.

Two Detailed Rail Maps

Northeast Rail Map

A couple of supremely detailed rail maps to bring to your attention, both of which show every line and station of long-distance, regional and commuter rail networks. There’s one for California, which uses a Beck-like, diagrammatic design, and one for the Northeast Corridor (see above), which opts for geographic accuracy. Despite the differences there’s a lot of overlap on the two design teams. Creative Commons licensed, with printed posters available.